
Detailed Case Study: Asynchronous Event-Driven Communication on OKD
Dive into a comprehensive case study of a microservice architecture leveraging asynchronous event-driven communication on OpenShift Container Platform (OKD). From design objectives to case studies, this article explores how the system handles traffic, scales and copes with component overload scenarios, employing tools like Apache Flink and Grafana.
9 min read
In this Article:
- Introduction and Project Objective: Overview of the project and its goals including implementing a microservice architecture based on asynchronous event-driven communication running on OpenShift Container Platform.
- Main Features and Functionalities: Review of the system’s main features and functionalities such as asynchronous communication, event processing with Apache Flink, and system behavior under load.
- Technologies and Tools: Detailed examination of the technologies and tools used in the project including OpenShift Container Platform (OKD), Apache Kafka, Apache Flink, PostgreSQL, and Grafana.
- Technical Summary and Grafana Dashboard Metrics: Deep dive into the demo application’s technical summary, as well as a discussion on the key metrics captured on the Grafana dashboards during traffic simulations.
- Case Studies: Exploration of case studies involving overloaded components, demonstrating the resilience and scalability of the architecture. Examples include overloaded Flink jobs, PostgreSQL database, and Nginx proxy server.
Introduction
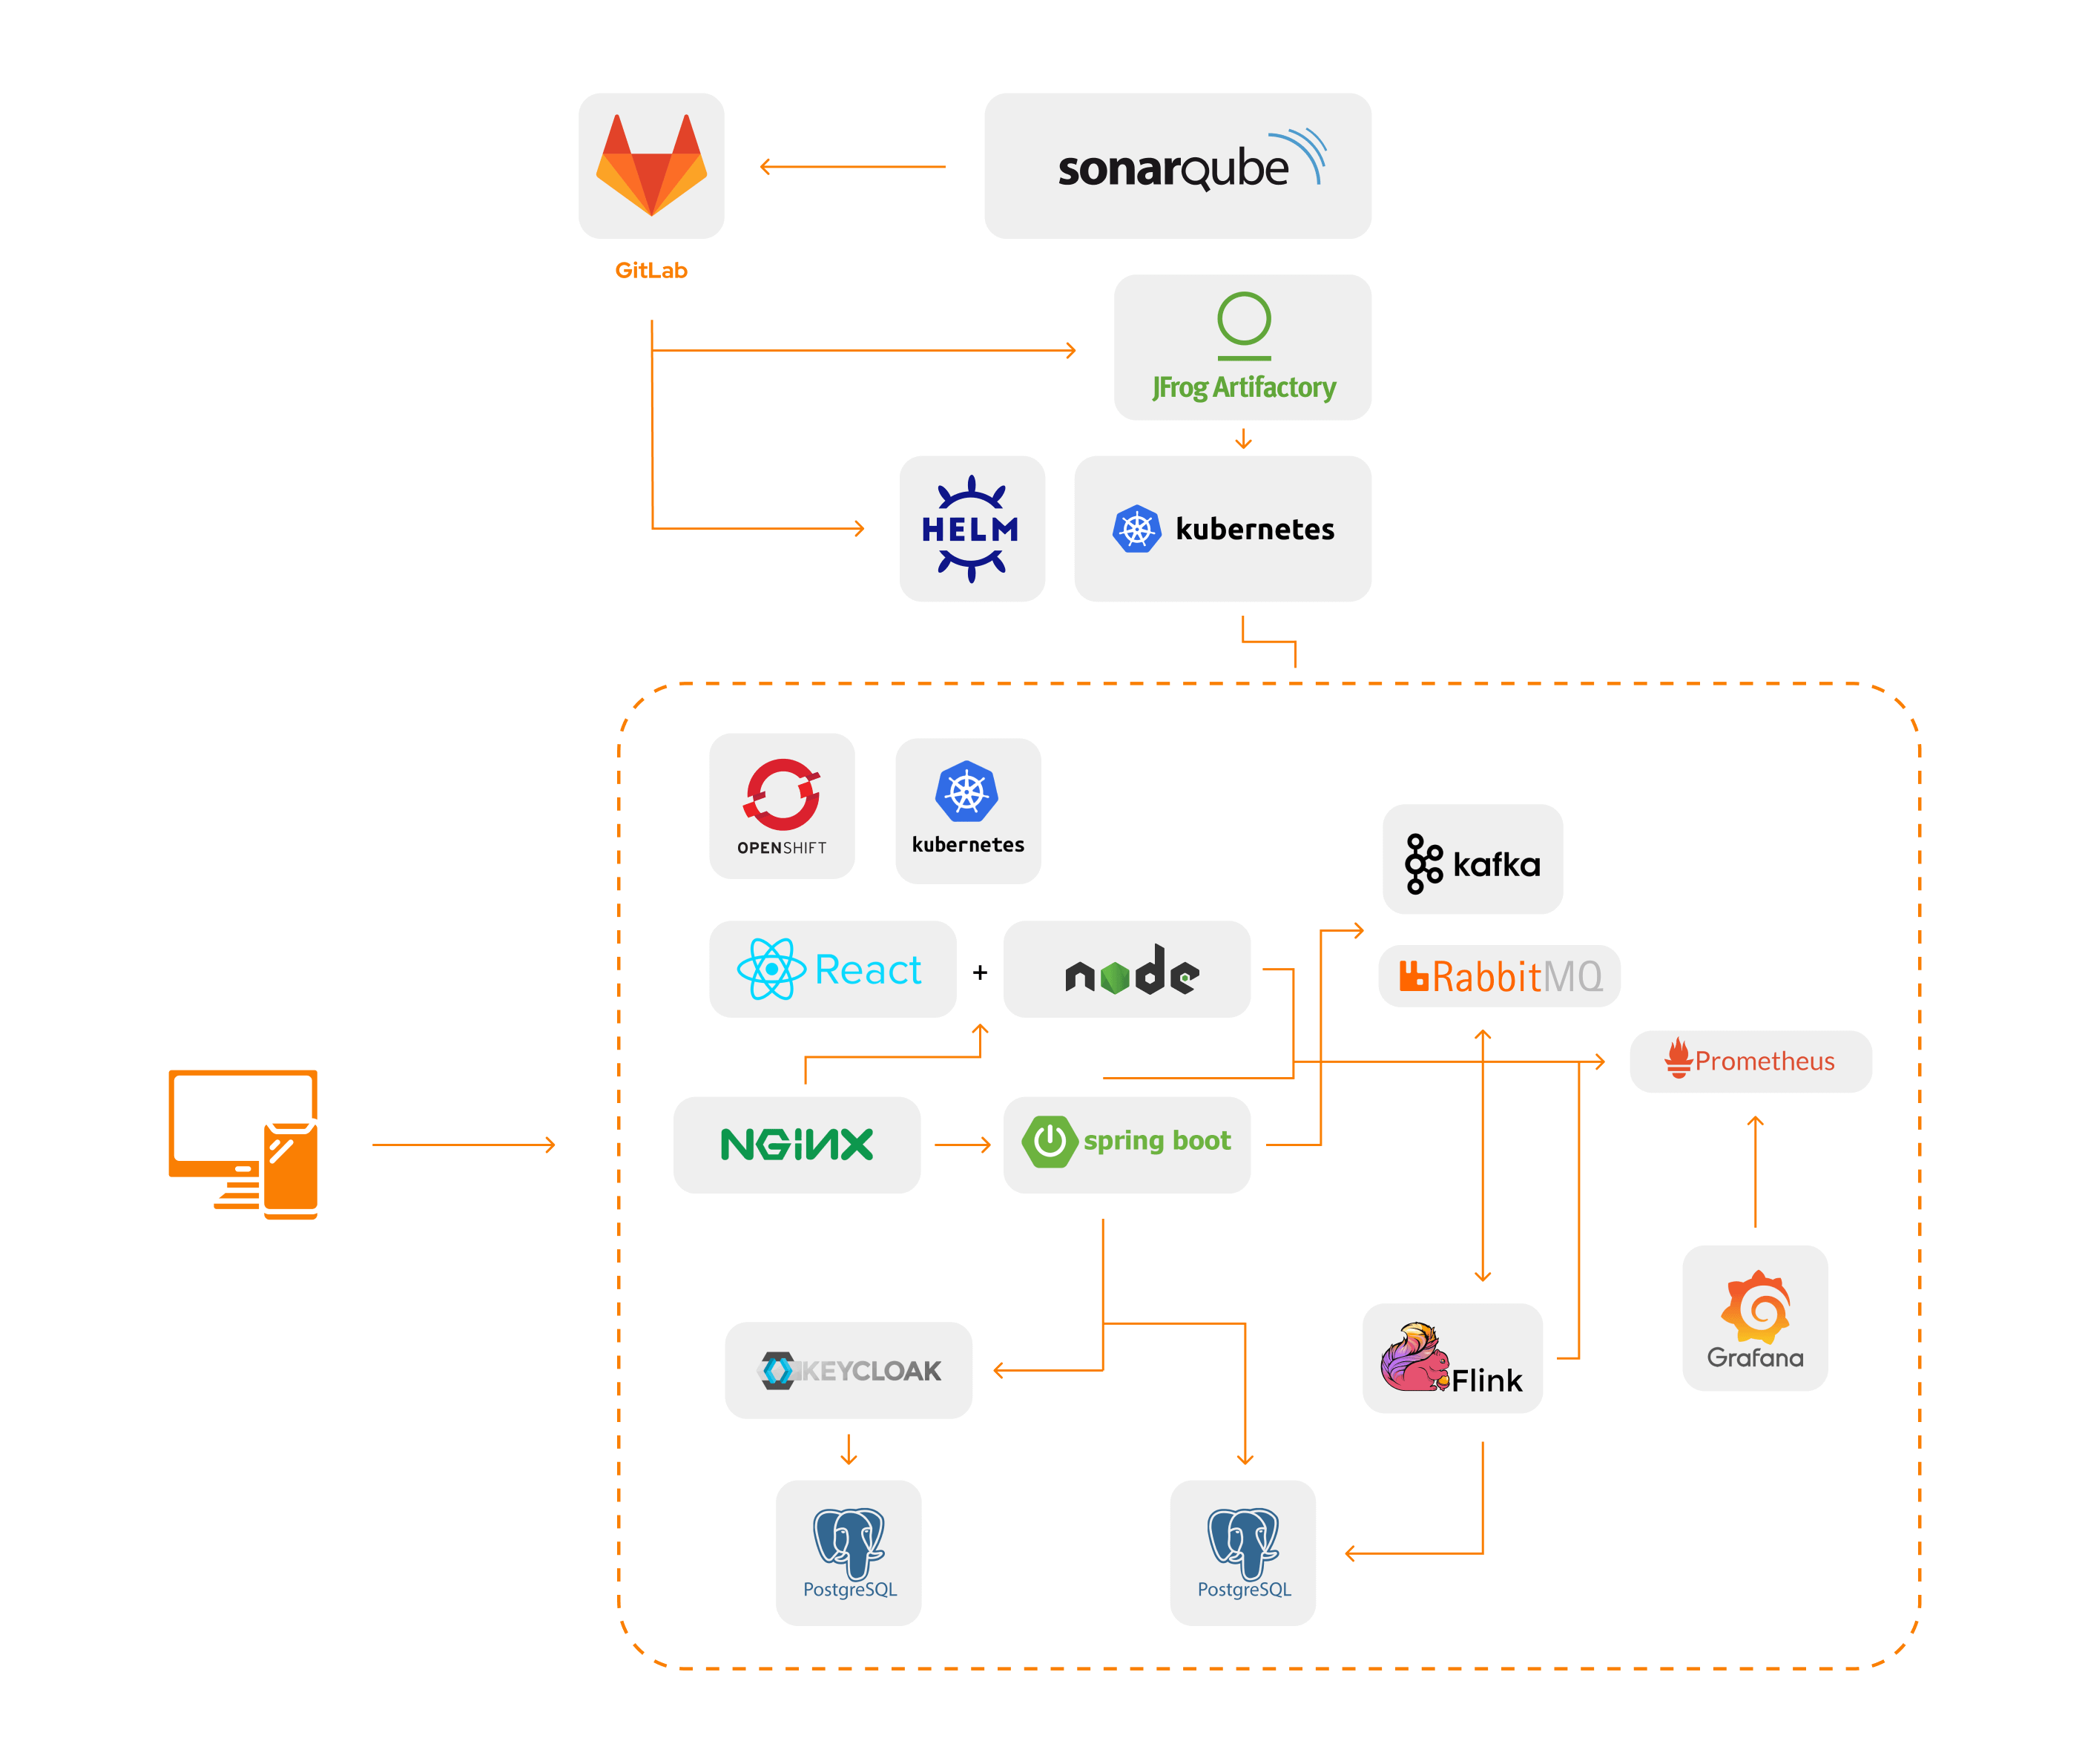
The subject of this project was to design and implement a microservice architecture based on asynchronous event-driven communication running on OpenShift Container Platform. This article takes a detailed and technical approach to describe the intricacies of building an event-driven microservices architecture on OpenShift (OKD) from our previous article.
Project Objective
The goal was to present the functionalities of asynchronous communication, Apache Flink jobs operations, Pods liveness and readiness probes, Pods auto-scaling and the system behavior during component overload situations.
Main Features and Functionalities
- Asynchronous communication using message queues
- Stateless gateway application connected with KeyCloak for identity and access management
- Real-time event processing with Apache Flink
- Database operations performed by Flink jobs on PostgreSQL
- System behavior under load and component overload
- Pod auto-scaling
- Liveness and readiness checks
- Nginx as a reverse proxy with rates limits
Technologies and Tools
- OpenShift Container Platform (OKD)
- Helm
- Grafana, Prometheus, Prometheus PushGateway
- Jfrog Artifactory
- Apache Kafka / RabbitMQ
- Apache Flink
- PostgreSQL (PSQL)
- Keycloak
- Java, Spring (for Gateway application)
- Nginx (proxy, rate limits)
- GitLab CI/CD
- Locust, WRK
Technical Summary
The demo application was built to demonstrate a microservice architecture using queued messages for asynchronous communication.
During the demo, we simulated application traffic by sending HTTP requests using two tools, wrk and locust. We monitored the architecture’s behavior during the test using Grafana dashboards that pulled data from Prometheus services.
We configured Grafana alerts, linked to our Slack channel, to notify us when certain metrics, such as the number of Gateway applications, reached predetermined thresholds.
We observed the number of jobs, the CPU consumption, the number of HTTP requests received by Gateway, and the number of messages queued for each job.
We also tracked the number of incoming messages to Kafka and ensured that all metrics were consistent in terms of their increase and decrease with the amount of traffic on the gateway and data exchange inside the architecture.
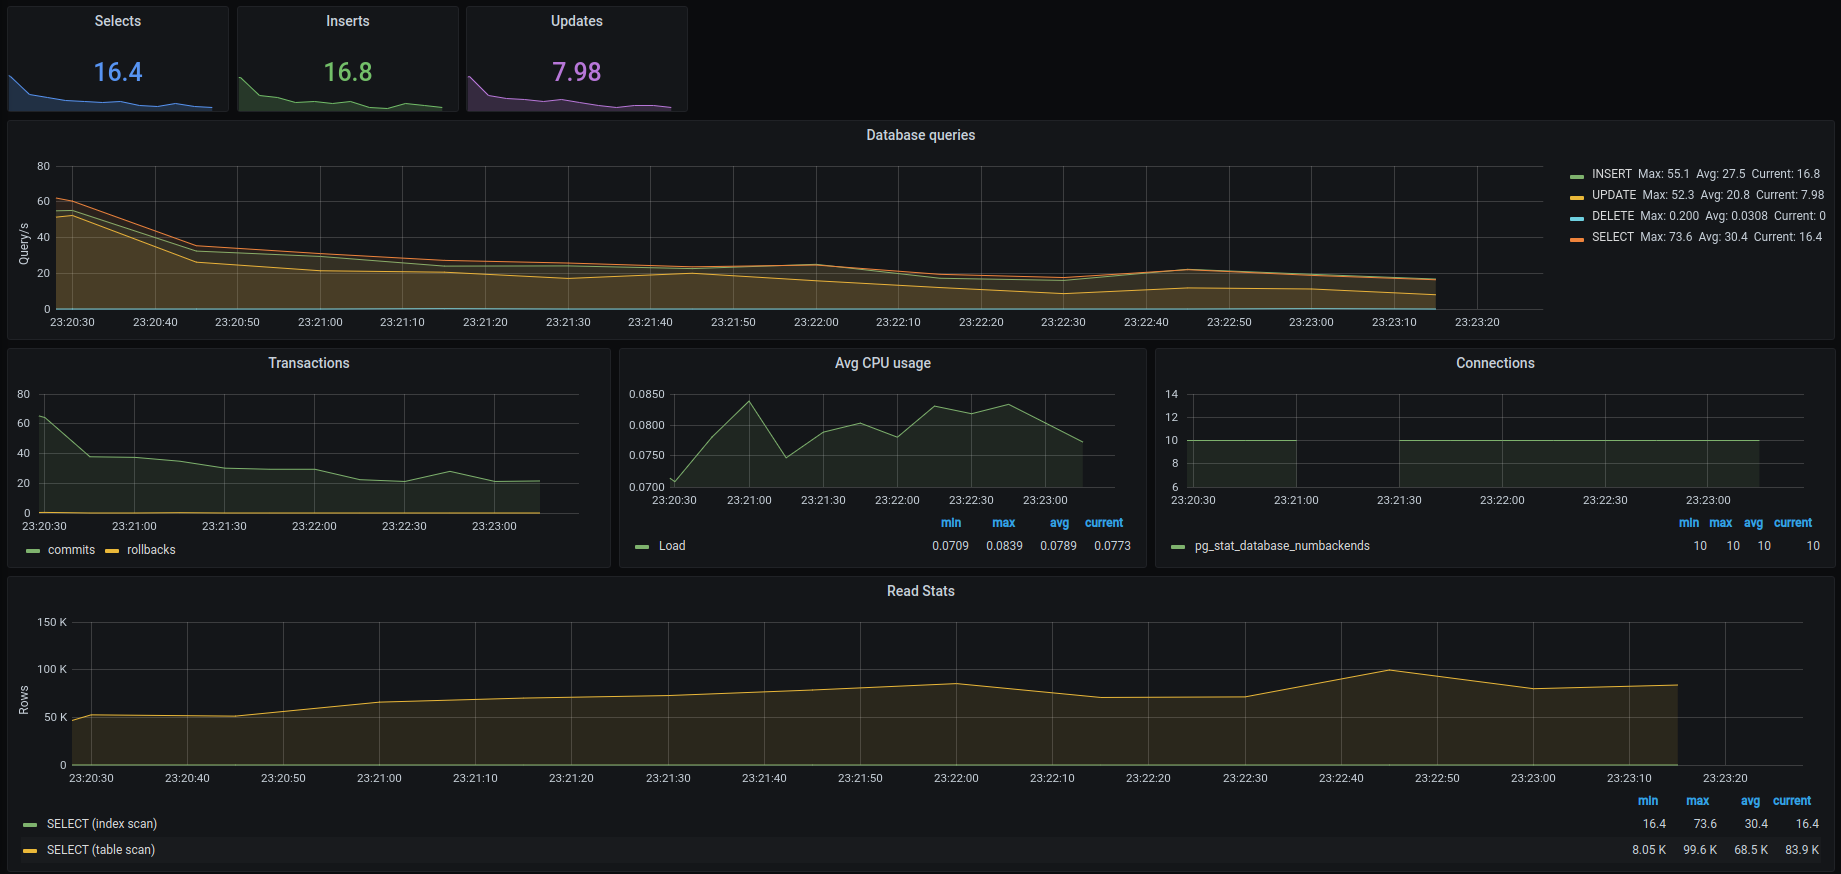
Grafana dashboard – database metrics
- Current number of queries: insert, update, select
- Number of operations (select, insert, update, delete) over time
- Number of transactions (commits, rollback) over time
- CPU usage over time
- Database connections over the time
- Scanned rows over the time
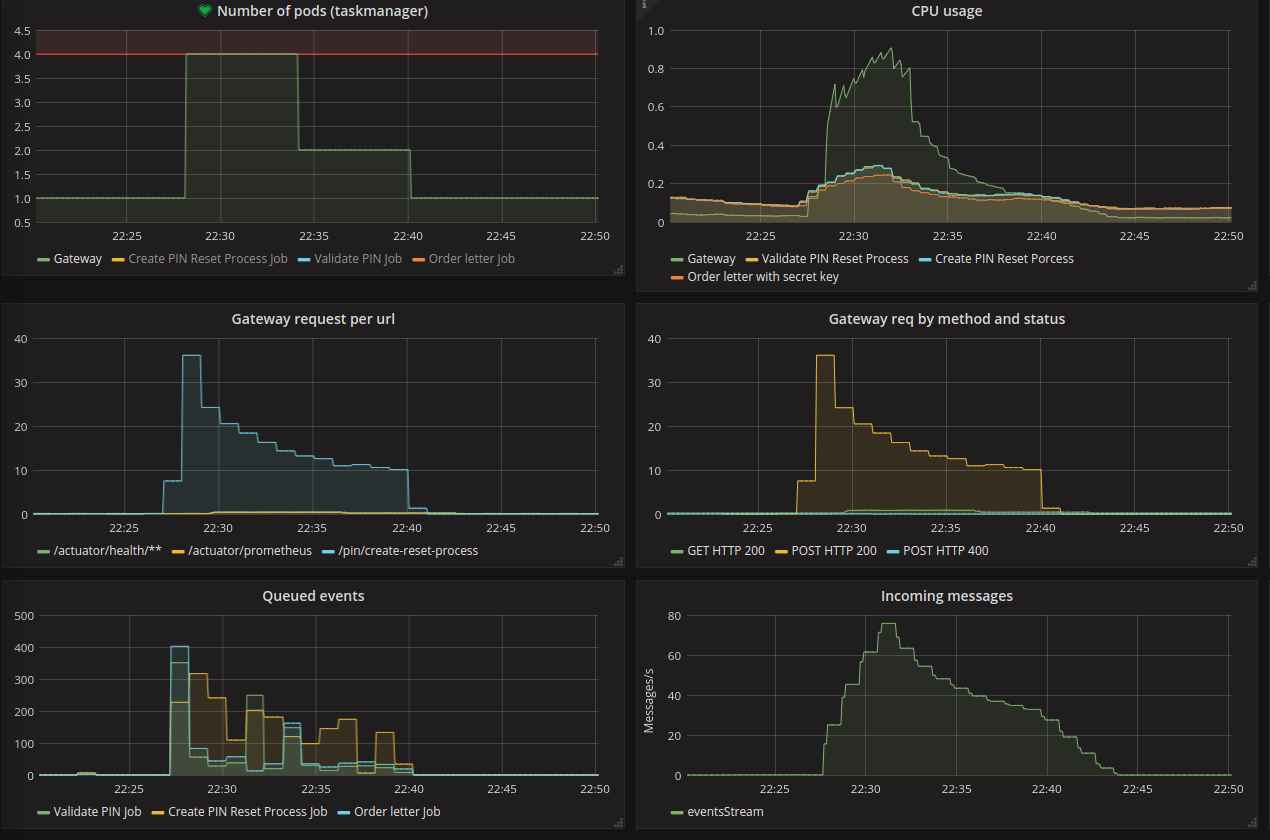
Grafana dashboard – application metrics
- Screenshot of the application metrics where we simulated traffic for 15 minutes
- The number of jobs was set to 2 instances (permanent) – due to the fact that Apache Flink autoscaling does not work on this version of OpenShift and k8s
- Number of Gateway applications was autoscaled over time – it reached 4 pods
- Number of Gateway pods has reached the limit that was linked to the alert
- CPU consumption has increased significantly along with more Gateway applications, in the case of our jobs, this jump is not so visible but it is also recognized
- Number of HTTP requests currently received by Gateway
- Number of events (messages) that each job currently has queued, due to the fact that messages are sent both by Gateway and between jobs, these numbers vary over time depending on that
- Number of incoming messages to the Kafka
- All metrics are consistent in terms of their increase and decrease along with the amount of traffic on the gateway and data exchange inside the architecture
Case Studies
Overloaded Flink
We prepared a secondary endpoint to start process without waiting for validation results. This enabled the Gateway service to produce messages quickly in Kafka topic, which were consumed by Apache Flink Jobs. We observed two scenarios:
- Overloaded Apache Flink Jobs: In this scenario, jobs could be overloaded if the database is responding slowly or there are a lot of incoming messages from Kafka Topic. This does not impact the overall system due to the async processing data type. Also, the continuously increasing number of messages in Kafka Topic does not impact its performance.
- Not working Apache Flink Jobs: When Apache Flink Jobs are failing due to lack of resources or general cluster failure, messages produced by the gateway are stored in Kafka Topic for a defined amount of time (retention time Kafka) and wait for processing after restoring the Apache Flink Cluster.
Overloaded PostgreSQL
We reduced the resources available for the PostgreSQL database to 256MB of RAM and 0.1 CPU and generated a lot of data to be processed by Apache Flink jobs. We observed two scenarios:
- Overloaded PostgreSQL: All operations were completed, but slower than with a not overloaded database. The number of unprocessed messages in Kafka grew but with no impact on Kafka’s performance. Apache Flink jobs processing speed increased after the performance of PostgreSQL was restored.
- Not working PostgreSQL: The number of unprocessed messages into Kafka grew but with no impact on Kafka’s performance. Messages that were not successfully processed by Apache Flink jobs were retried until the PostgreSQL was up and running again.
Overloaded Nginx
For this scenario, we configured the Nginx proxy with specific limits:
- 1 request per second per IP to our API (Gateway)
- Buffer of 25 requests which can exceed this limit ratio
This meant that if 26 requests arrived from a given IP address simultaneously, Nginx forwarded the first one to the upstream server group immediately and put the remaining 25 in the queue.
As you can see in the screenshots below, after reaching our limit, new queries were rejected by our proxy server.
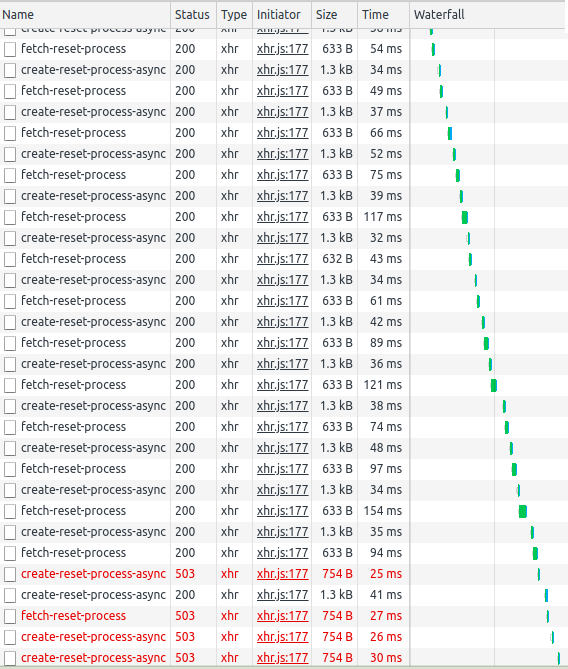
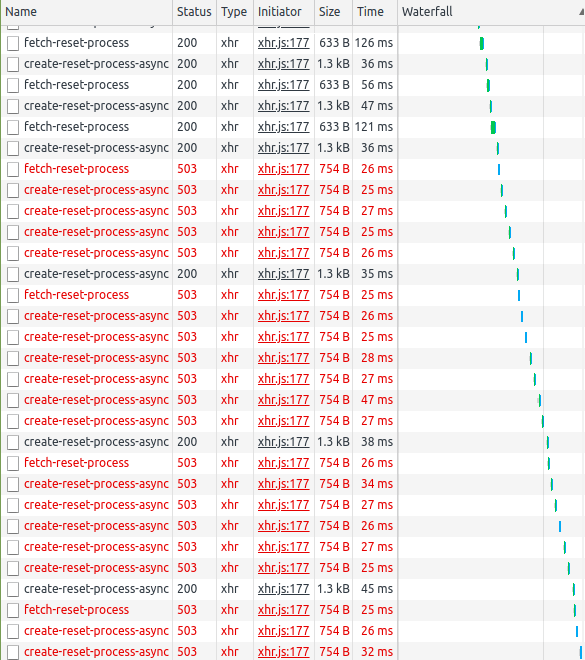
Upon reaching limit, new queries were rejected by our proxy server. These types of limits can be enforced in various configurations, allowing for different behavior depending on the exceeded limits. For instance, a limit of 100 queries per hour with a buffer of 100 queries could be set. This would allow one IP to use its limit quickly, but then be blocked for a longer time.
Below is an example Nginx configuration that has been implemented:
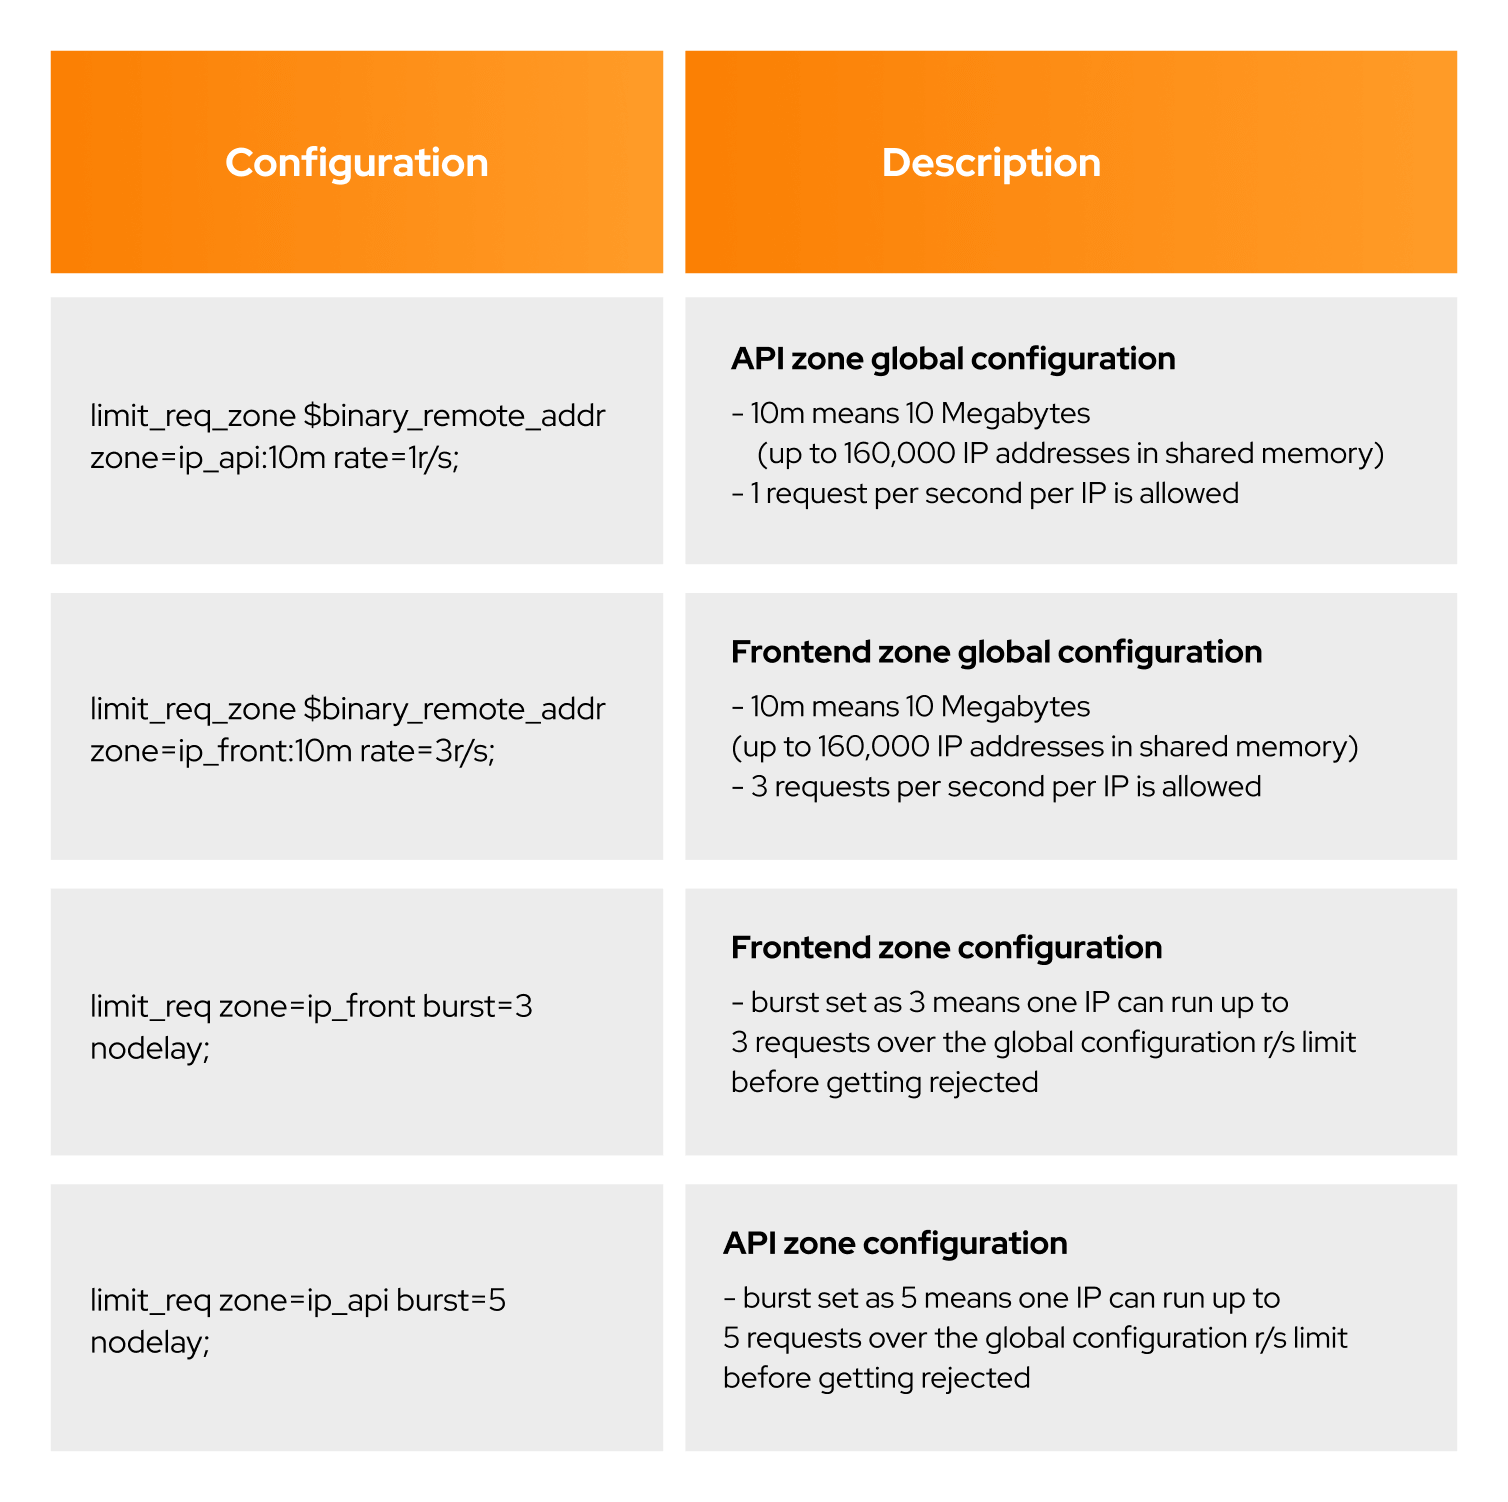 We recommend enforcing such security measures outside the application’s infrastructure (e.g., k8s) due to resource limitations inside k8s.
Conclusion
This project provided a detailed exploration of an event-driven microservices architecture running on OKD. Through simulated traffic and load, we were able to demonstrate the system’s behavior under different scenarios, including the operation of Apache Flink jobs, message queuing, pod auto-scaling, and component overload situations.
With a well-designed architecture and effective use of modern tools and technologies, we achieved a resilient and scalable system capable of handling large volumes of data and user requests.


